Mapping Dominance: The Patriot's Dynasty
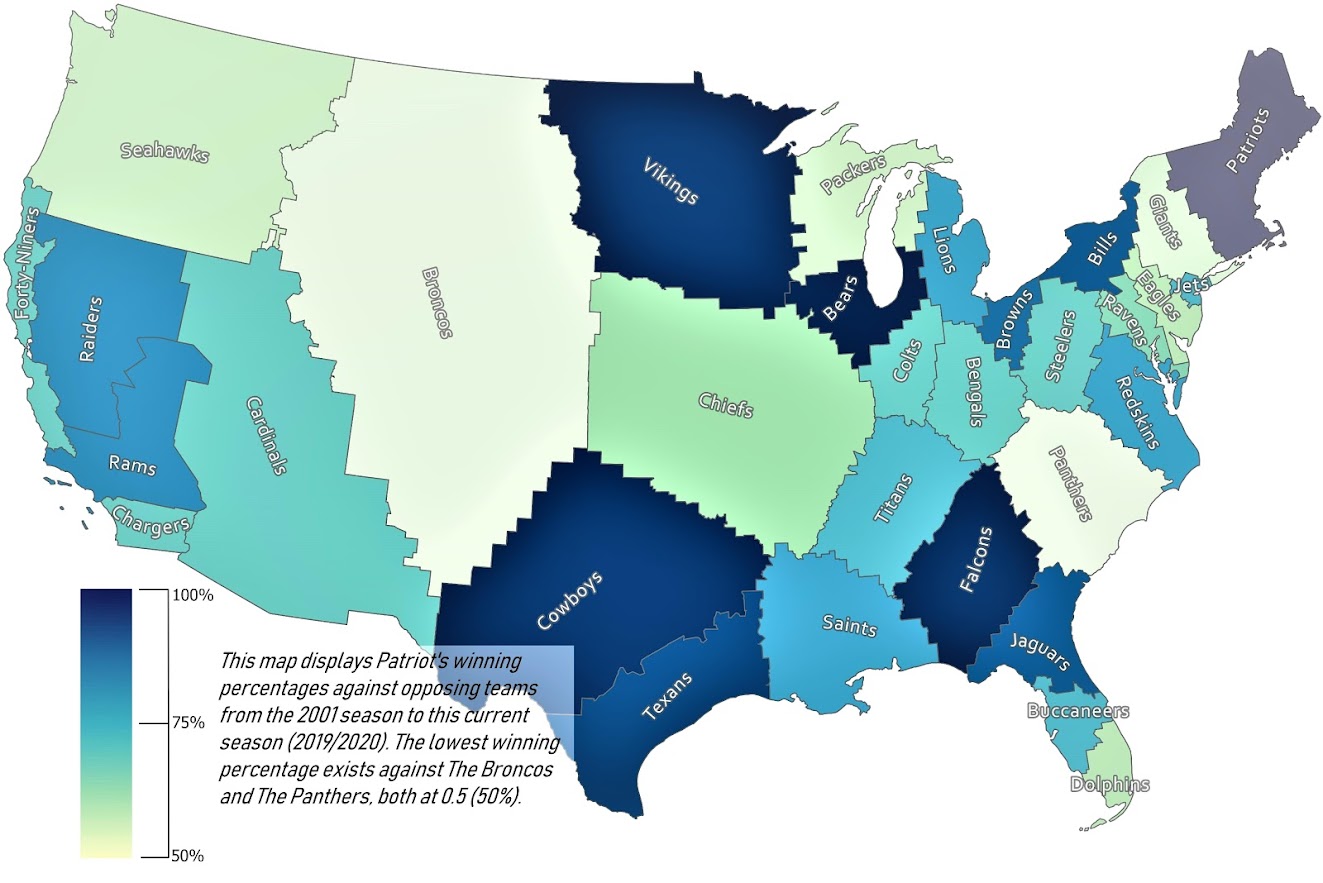
Patriot's Head-to-Head Records From 2001 To Present Day
I created this map to help visualize The Patriot Dynasty, which started in 2001 with their first super bowl win. It includes all regular and postseason games, but does not include pre-season. Clicking on a team's polygon will show the Patriots winning percentage and the point differential against the opposing team selected from the 2001 season to present day. There is also a "Highlights" link, which will open up a youtube video of my favorite game or moment between the associated team and The Patriots.
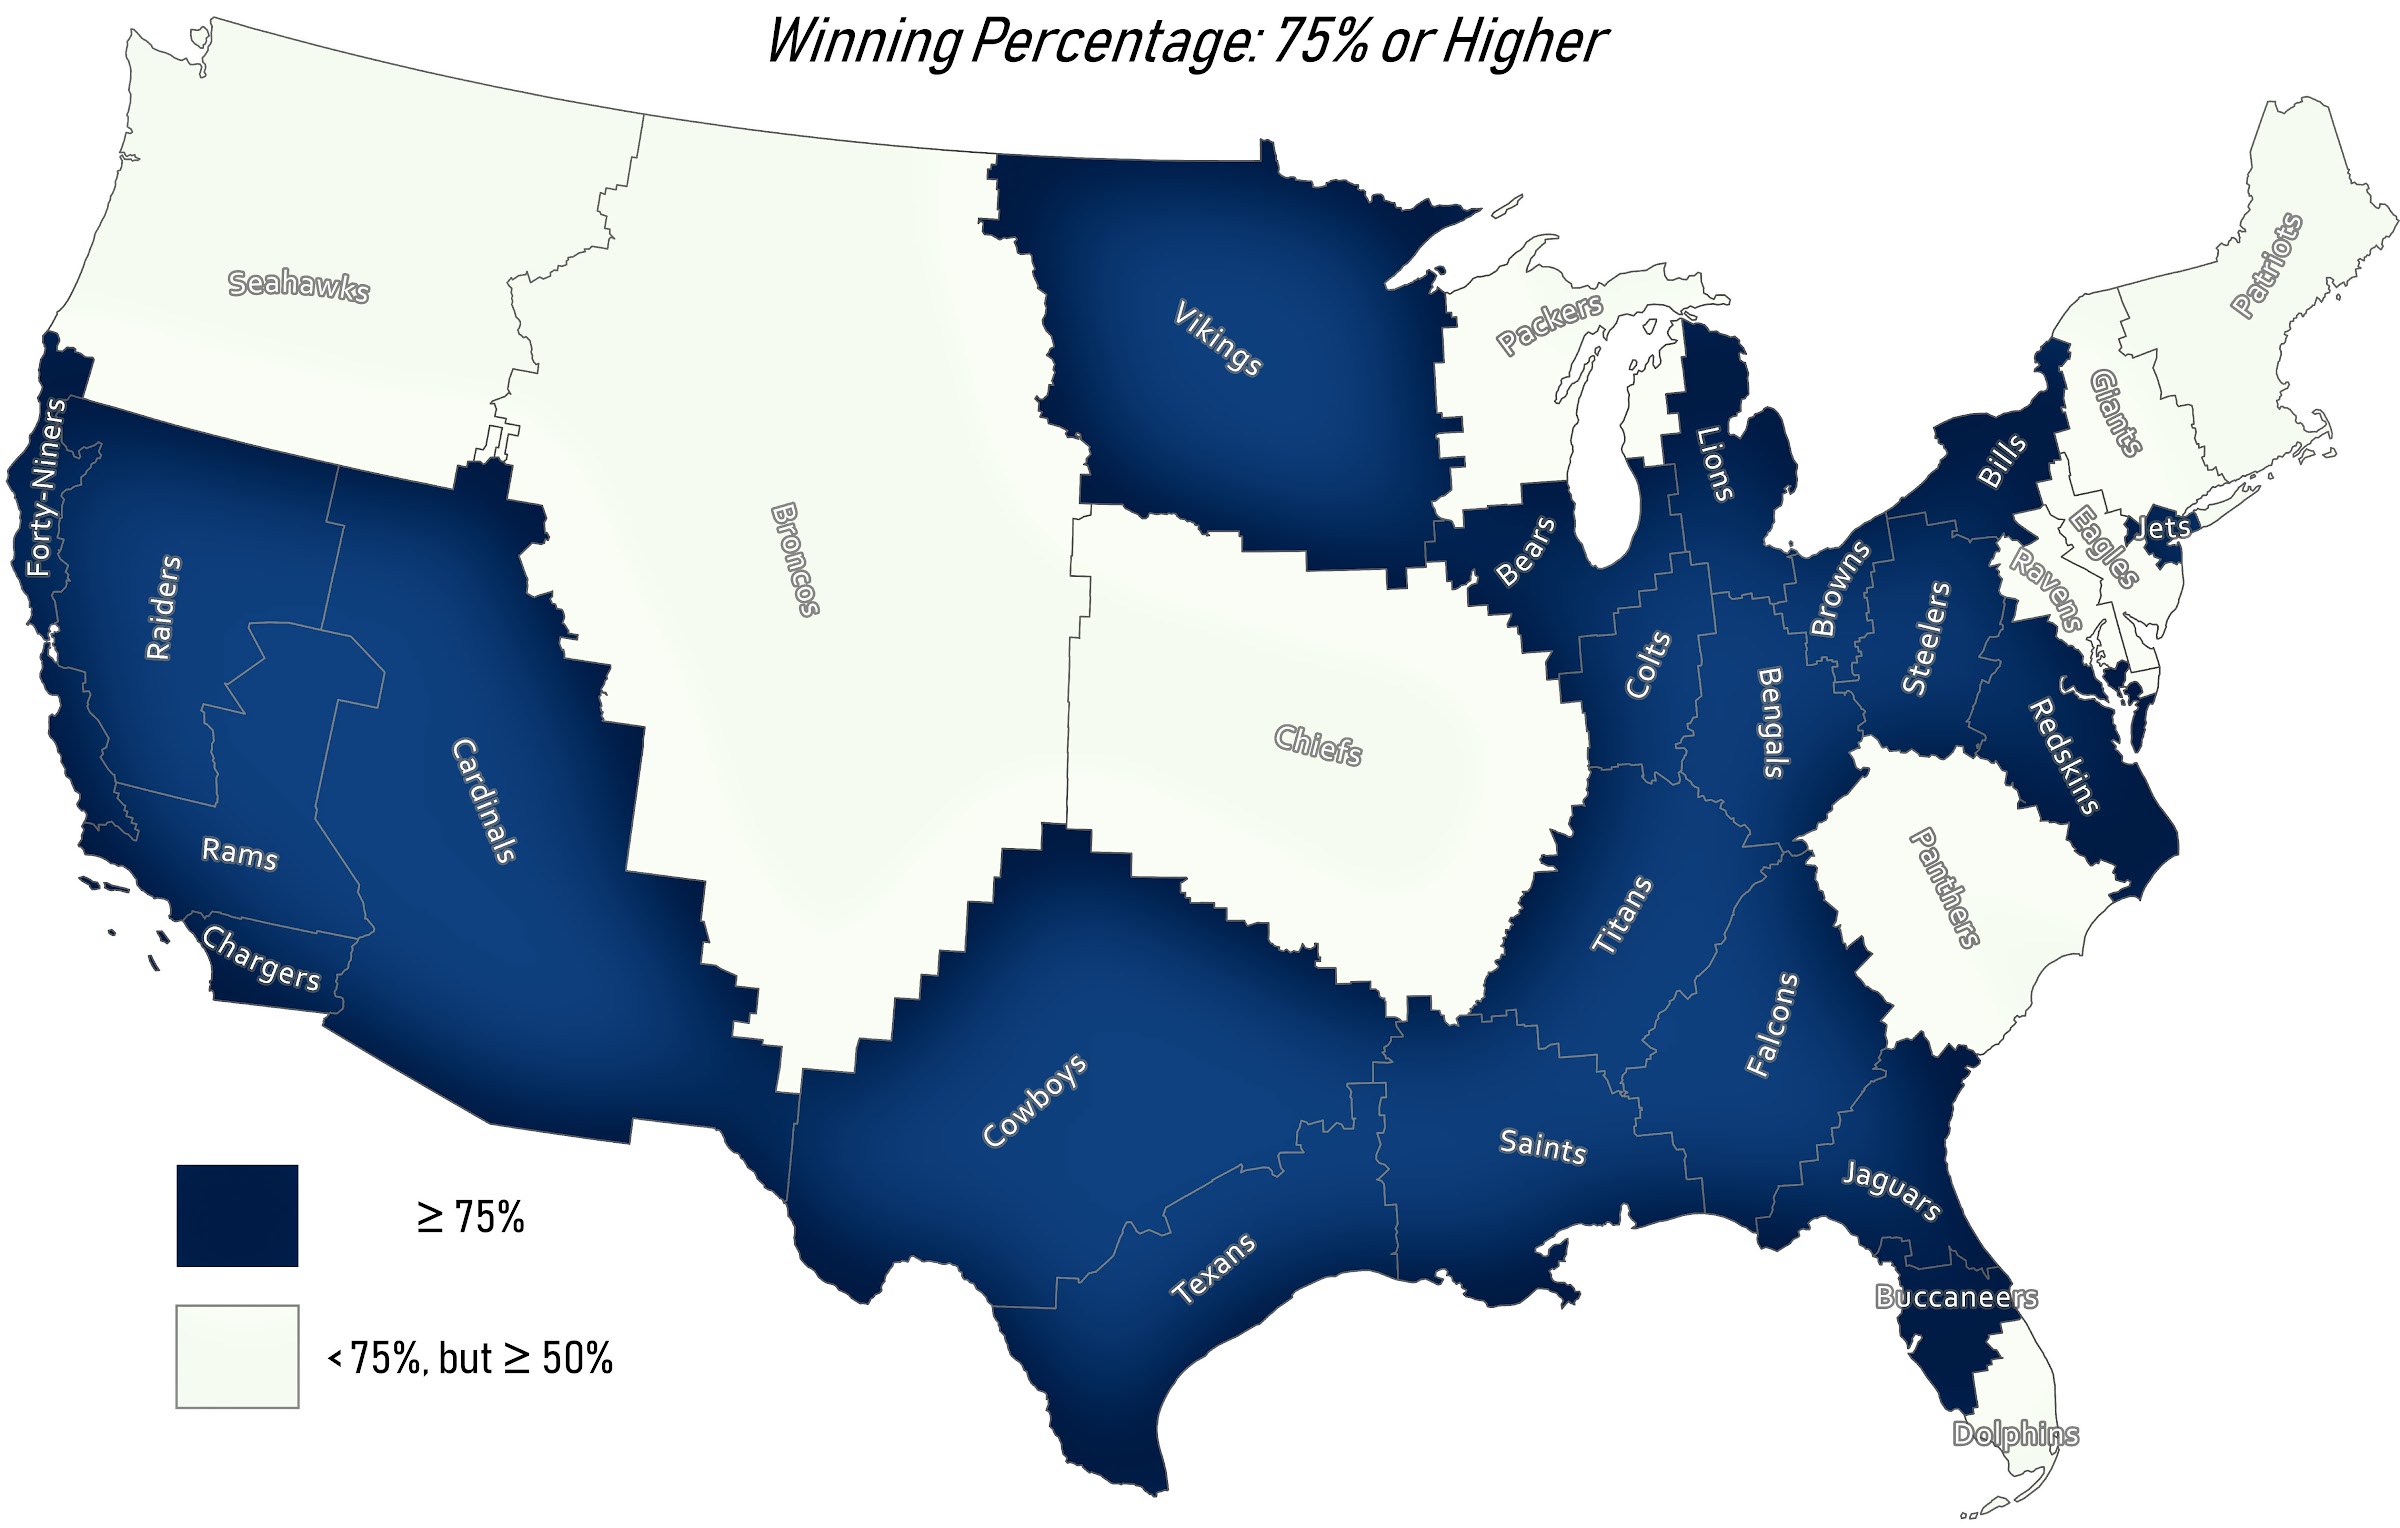
Since 2001, The Patriots have played in 50% of all super bowls, winning 33% percent of all super bowls. Nine super bowl appearances, Six super bowl wins. They have completed 18 consecutive winning seasons (2001-2018), their total winning percentage over this time being 77%. They have a 50% or higher winning percentage against every team in the NFL, while remaining undefeated against four teams: Bears, Vikings, Falcons, and The Cowboys.
How I Made This Map:
I started by scraping the Patriots head to head statistics from ProFootballReference.com using R Studio. A guide on how to get that done can be found here. I gathered all of the tables and organized all of the data in excel. I then created a table that contained every NFL stadium and their individual coordinates. The statistics for each team were joined after the polygons were created.
I used R Studio to create the polygons you see in the webmap. To do this, I used the coordinates of each NFL stadium and the center point of every county. Each team polygon is made up of all of the closest counties to each stadium.
The first version of this map from the R analysis looked slightly different than what you see above. Some of the polygons, especially in the southwest, just didn't look great. I cleaned those up and realigned them in Pro. I completed the data join there, and calculated some extra fields and voila! I got a pretty decent looking layer. The raw geojson file can be found here.
Unfortunately, the R code and the steps that I made to get to this point are a bit chaotic, and I also didn't document them very well. I primarily used this as a guide, but had to make some changes for my own purposes.